With the help of my fellow Satisfactory enthusiast, ChaosCow, I have created a spreadsheet for planning out a complete factory from ore to elevator. The spreadsheet can be found here.
Overview
The spreadsheet is designed to hit a target production rate of the four final space elevator items - Assembly Director System, Magnetic Field Generator, Nuclear Pasta, and Thermal Propulsion Rocket. You can put in the target amounts yourself, and the entire rest of the spreadsheet will adjust accordingly. You need only determine how much you want out and which alternate recipes you want to use, and the numbers all fall into place automatically.
Features
All alternate recipes are programmed in - just use the dropdown menu on each product's page to select which one you want to use.
Power needs are automatically calculated for the whole factory, including whatever machines are necessary to process fuel for the power plant. Select which fuel type you want to burn from the dropdown on the power generation page and everything else will adjust accordingly. This includes plutonium, and the power generated from producing plutonium is figured into the calculations as well.
Oil processing uses the Chaos Method to provide a more than 50% increase in return on crude oil processing. Details below.
Clock speeds for mining, production, and power are all separately adjustable. This is mainly for those who play with mods, so that higher-tier machines can be accounted for by the spreadsheet.
How to Use
To use this spreadsheet for yourself, simply follow these steps:
Ensure that you have a Google Drive account.
With the spreadsheet open, click File and choose Make a Copy. This will create an exact copy in your own Google Drive which you can then edit.
To use the script which automatically calculates power usage and optimizes oil processing, you'll need to enable it first:
With the spreadsheet open, click Tools and choose Script Editor.
At the top of the page, click Run. Google will complain that the app is unverified but since you're running your own local copy of the app, for which you can see the source code, there is no danger to you. Click on advanced and approve the app.
To verify that the script is working, go to the Configuration page in the spreadsheet and enable either of the auto options (via the dropdown). The box next to it should change from "Done" to "Working...".
Miscellaneous Notes
The spreadsheet actually slightly over-estimates required quantities of resources due to rounding up machine quotas. For example, if there is a demand for 50 total units per minute of product X and its recipe produces 30 parts per minute per machine, the spreadsheet will call for 2 machines resulting in 10 leftover parts per minute. The demand for each component of the recipe for product X will be adjusted to satisfy the full consumption of both machines for product X (all 60 parts per minute, not just the 50 actually needed). As a result, there will be some excess parts produced every step of the way. For this reason, recipes with more than one output should have overflow sinks so that a backup of one product does not halt production of the other.
As a result of minor over-estimation of resource quotas, not all machines in the factory will be powered up at all times. Many processes will have (at most) one machine not running due to overflow. For this reason the actual power consumption of the factory will likely be slightly lower than the spreadsheet predicts.
This spreadsheet has only been tested with Google Sheets.
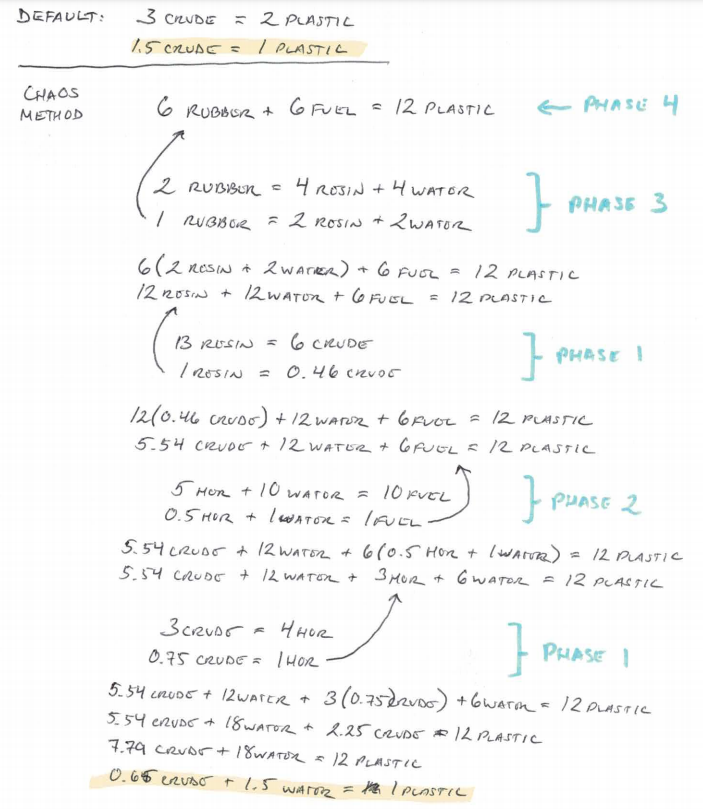
This 4-phase method for oil processing comes from ChaosCow and significantly increases returns from a given amount of crude oil by "stretching" it with water.
The process can be summarized as follows:
Phase 1: Resinize. Convert crude to heavy oil residue and polymer resin.
Phase 2: Fuel. Stretch crude oil with water to produce fuel.
Phase 3: De-resinize. Stretch polymer resin with water to produce rubber and plastic.
Phase 4: Recycle. Cross-recycle plastic and rubber into each other, stretching them with fuel.
Introducing water in phases 2 and 3, and then feeding back the already-stretched fuel in phase 4, represents an approximate 57% increase in the amount of plastic and rubber that can be created from a supply of crude oil. The mathematical theory for this increase is included here.
Note that these calculations actually slightly over-estimate the amount of crude needed, since both the resin and residue recipes in phase 1 produce excess residue and resin (respectively) as a by-product which can be fed back to reduce the production quota.
To satisfy demand for resin and residue elsewhere in the factory, more refineries can be added to phase 1. For details on this, see "Linear Optimization" below.
Most factories will require both Heavy Oil Residue and Polymer Resin.
The recipe for either of these products also produces the other, but the
recipes each produce these products at different rates. This situation
is described by the following table:
PR
HOR
Recipe PR
130
20
Recipe HOR
20
40
The resin recipe is more efficient in
producing resin while the residue recipe
is more efficient in producing residue.
The problem is that choosing one and only one recipe to meet the needs
for both PR and HOR will waste enormous amounts of power and space with
a huge number of machines while producing huge amounts of excess product
which must be either sunk or stored.
The question becomes this: "given a target amount of PR and a target
amount of HOR, what is the smallest number of machines for each recipe
that can be used to hit or exceed both targets?"
The setup for this case involves two parallelograms:
HOR_Demand <= 40h + 20p  <= upper_bound


PR_Demand  <= 20h + 130p <= upper_bound
p indicates the number of machines using the PR recipe, while
h indicates the number of machines using the HOR recipe.
The upper_bound is an arbitrary number greater than either demand.
A new parallelogram of valid solutions is formed by the intersection
of these two parallelograms. Any point (h,p) inside this new
parallelogram represents a combination of machines that will:
Produce enough HOR
Produce enough PR
Not exceed upper_bound total amount of PR and HOR.
The point representing the lowest possible number of machines in total
will be the bottom-left corner of the solution parallelogram, where
h+p is lowest.
Fortunately Google's OR-Tools library provides a service for easily
finding a solution to this kind of problem. This spreadsheet includes a script which uses this library to automatically optimize the number of refineries producing HOR and PR.